This quote by Spock explains what most designers instinctively understand. It’s easy for numbers to mislead a team down the wrong path. You need to be constantly vigilant that you are measuring the right things, for the right reasons, in the right way.
So how can metrics help designers in a consistent, practical way?
1. Funnels convert complex user behavior into neat little chunks of data

Let’s say you have an amazing number of 5000 signups/week. However this is not actionable to you a designer. Even if you have a trend on top saying signups are going up or down, that is still not helpful.
Funnels are a great way to identify starting points for a redesign. You can prioritize what needs to be fixed first by looking at conversions and drop-offs. You can even kill the entire funnel and make a new one.
2. Upgrade to a goal oriented design process (stop the opinions)

Awesome illustration by The Design Team
Design reviews often spiral into confusion and vagueness. People focus on fonts and colors when the real stuff is the interaction and user flow. Use metrics to keep everyone clear headed and on point. Especially for non-designers, it’s a great way to start learning about potential impact of good design.
Use metrics to deal with superficial stakeholder feedback like “Make the logo bigger.”

What I imagined when I read the amazing tweet above
3. Test and validate your designs
It’s not always possible to extensively test your design with user research. Especially for superficial changes, use metrics to validate your designs once they are already live in production. This is the fastest way to work in small teams. Keep checking and validating that you are on the right track with user interviews and numbers.
Any extensive research effort with both interviews and a/b testing may lead to a month of wasted time when you can always validate on the go.

Old hero tile

New hero tile
For example we recently redesigned this hero tile for our product. Instead of extensive internal reviews and testing for a relatively minor change, we went ahead and made the change in a day. Then we checked that this was working better than the older version and it was.
Conversions increased by 7%!
4. Setup your own design metrics stack
In about 3–4 weeks you should be up and running so that your design team can make more data based decisions. Depending on how your product architecture is structured, it may be easier or harder. But it’s always worth it.
There are a ton of amazing services out there that make it much easier today.
Fullstory has an amazing rage quit feature that is amazing for any designer. You can watch video session replay of people who were recently pissed off by your app or service.
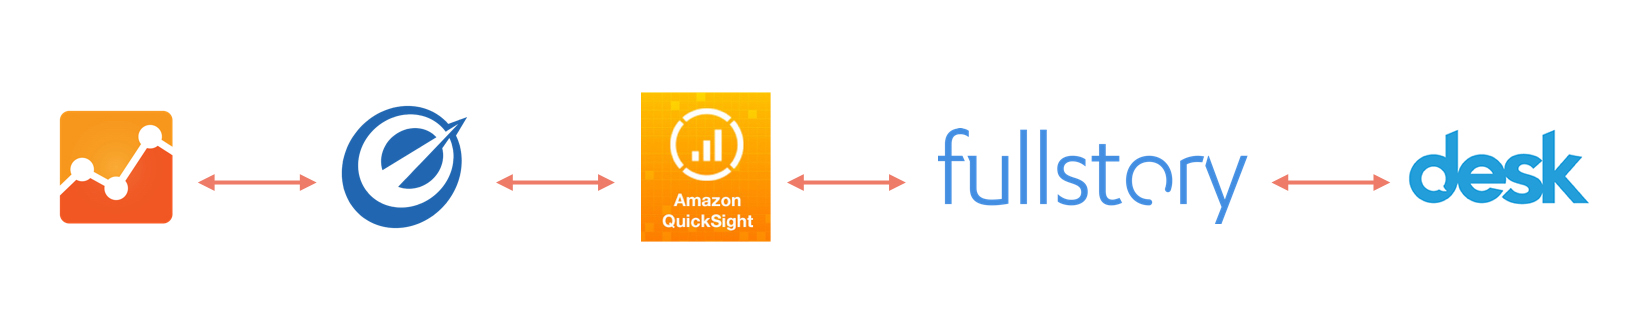
Services we use for qualitative and quantitative data. User interviews happen in parallel.
So we use GA for basic numbers, Optimizely for A/B testing, Amazon QuickSight for dashboards, FullStory for qualitative and quantitative and Desk for customer support data.
Eventually it’s really cool to have your own dashboard with all the behavior data in one place.
5. Metrics for discovery and exploration
The way people use software and apps is constantly changing. Looking at trends helps you understand user behavior at a deeper level.
You can gain new insights and convert them into radical ideas and designs for the future of your product, six months or a year from now.
Discover new usability and functional bugs

Although the engineering team is always tracking performance, sometimes problems slip through the cracks. Mysterious changes and dips in numbers can be an insight into a new bug in your product.
6. Find your user centric metrics

Joel uses our new product CandyBar
Never lose sight of the person who uses your software. It’s crucial to listen to the rich stories behind the numbers so that there’s always context.
What is success for your customer?

For example at ReferralCandy our success metric is the amount of referral revenue we help our retailers earn.

For the consumer side of our service, its the reward the consumer gets. It could be a gift or cash reward.
So really think of the user centric metric that your entire product team can get behind and design for.
User centric metrics fits neatly into user centric design
Thank you for reading! This article is based on a talk I recently gave at Tech in Asia 2017.
You can also check it out on Medium.